Timeseries charts with Chart.js
Somehow I always end up having to do timeseries charts. Chart.js is my tool of choice for that task, but I never seem to remember what options to pass and what format the data should have. Yesterday I must have spent 2 hours looking at the docs and trying various things, mostly because it didn’t occur to me to check the last project where I used them, Budgt
So anyway, note to self : this is how you do timeseries graphs in chart.js
const ctx = document.getElementById('chartCanvas').getContext('2d');
const data = {
// Labels should be Date objects
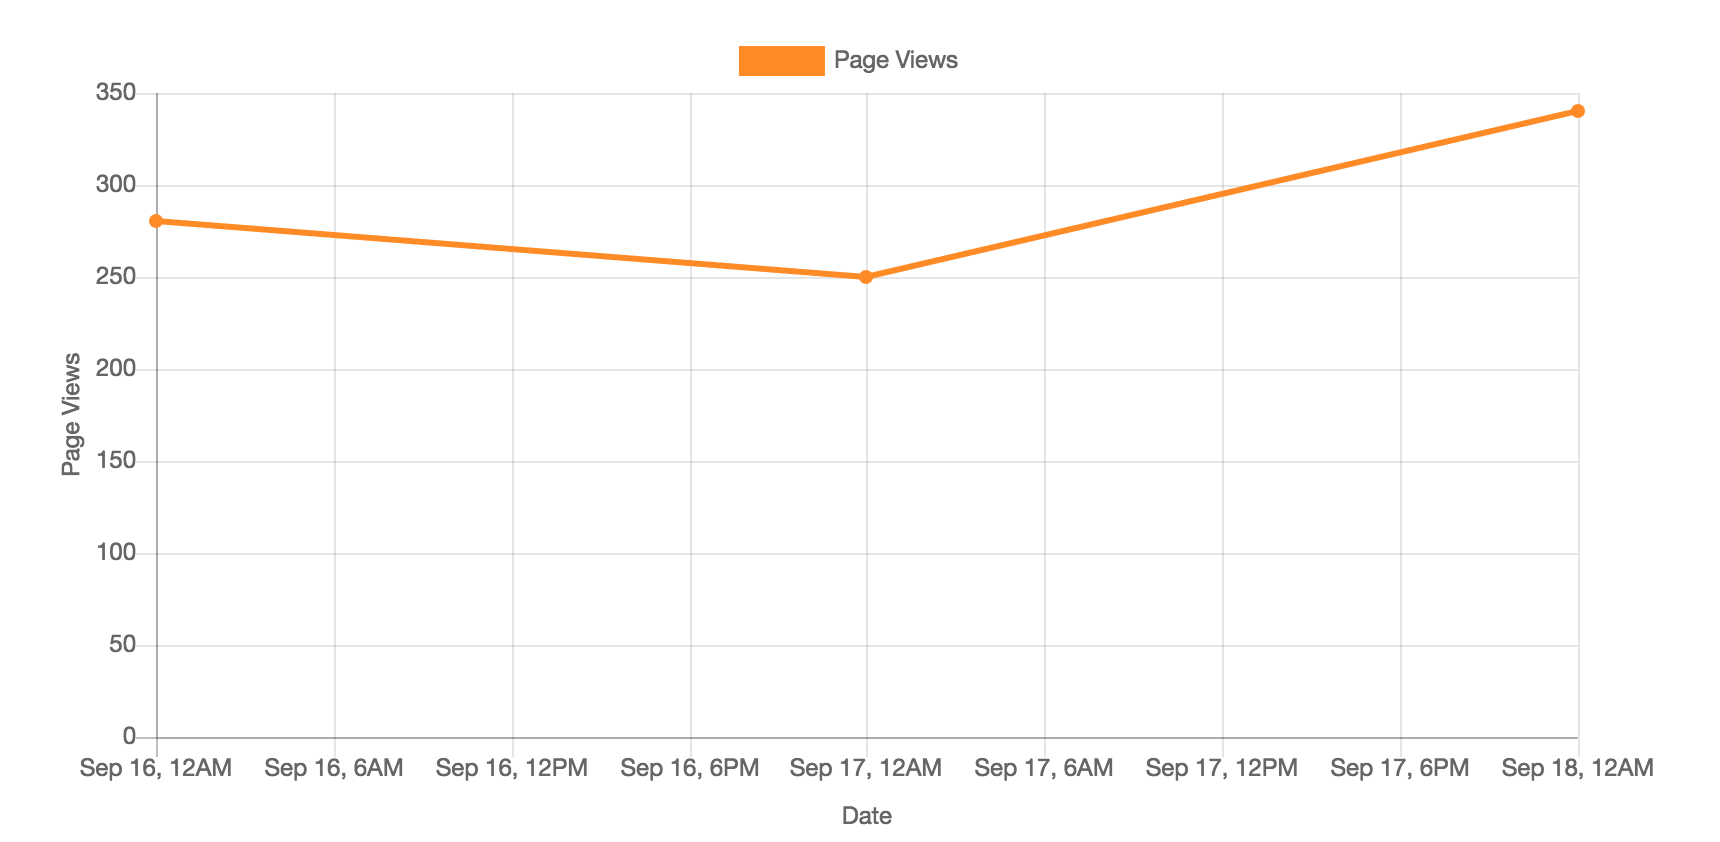
labels: [new Date(2017, 08, 16), new Date(2017, 08, 17), new Date(2017, 08, 18)],
datasets: [{
fill: false,
label: 'Page Views',
data: [280, 250, 340],
borderColor: '#fe8b36',
backgroundColor: '#fe8b36',
lineTension: 0,
}]
}
const options = {
type: 'line',
data: data,
options: {
fill: false,
responsive: true,
scales: {
xAxes: [{
type: 'time',
display: true,
scaleLabel: {
display: true,
labelString: "Date",
}
}],
yAxes: [{
ticks: {
beginAtZero: true,
},
display: true,
scaleLabel: {
display: true,
labelString: "Page Views",
}
}]
}
}
}
const chart = new Chart(ctx, options);
And here’s what it looks like:
That’s it. Hopefully I’ll remember I posted this here next time I need timeseries charts in chart.js